Space Capacity
Space Capacity matrices can be configured to view inventory capacity projections over time. To use this functionality the following configurations will need to be completed:
Configure the metric to view capacity in on SilverLeaf Setup.
Configure the capacity on the Location Card.
Configure Item Availability Setup Codes for capacities.
Configure Item Capacities.
Configure Spacing Schedules.
Once these configurations are completed, the Space Capacity matrix can be used to view available space:
Multiple Space Capacity matrices can be created to allow for different analyses. The Space Capacity matrix is very flexible. Users can dynamically set the following information within the matrix:
Change the Setup Code to allow different supply and demand combinations be analyzed.
View by different time buckets (Day, Week, Month, Quarter, Year, Accounting Period).
View at a high-level Location or as granular as the bins within a location.
Drill into the available quantities to see the items taking up the space. The item quantities can further be drilled into to view the components of supply and demand driving the space capacity calculations.
Space Capacity can be viewed by amount available, amount used, or percentages.
How to: Create a new Space Capacity Matrix
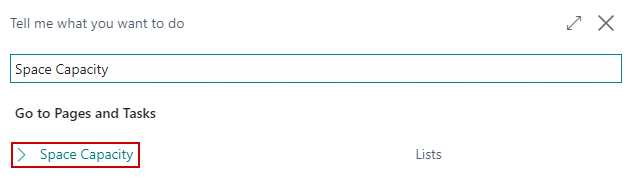
Click the magnifying glass, search for Space Capacity, and select the related link:
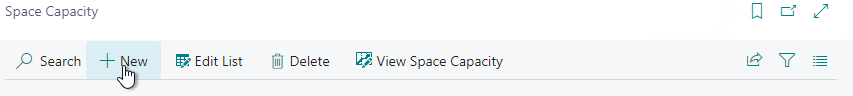
On the Space Capacity list, click New:
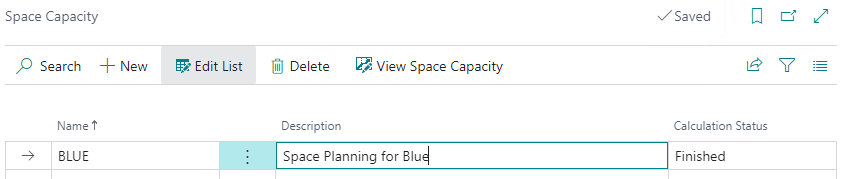
Enter in a Name and a Description for this Space Capacity Matrix:
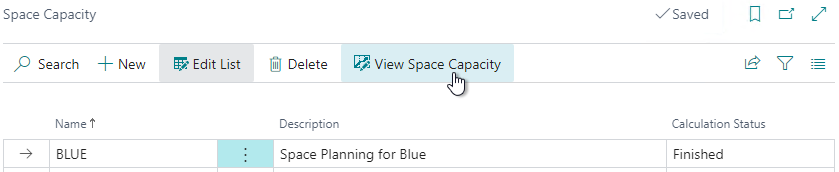
On the menu, click View Space Capacity to open the Space Capacity Matrix:
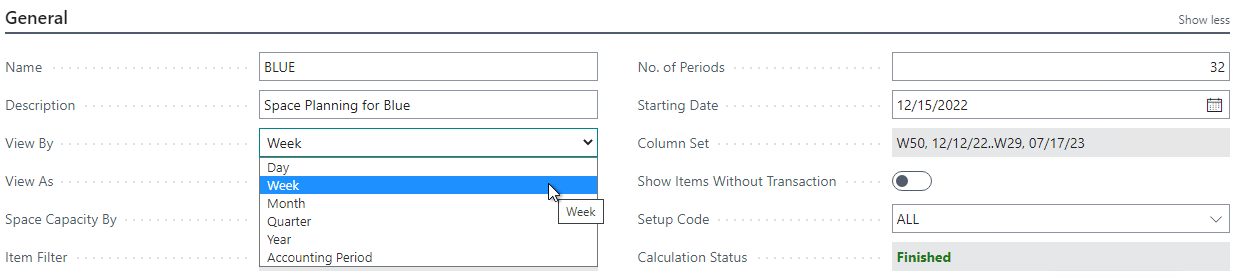
Select what period of time you want to view space projections:
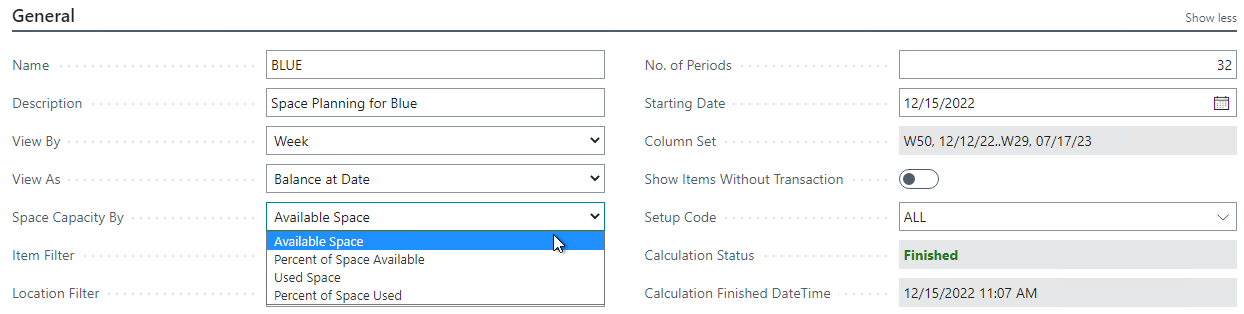
Select how you want to view space projections:
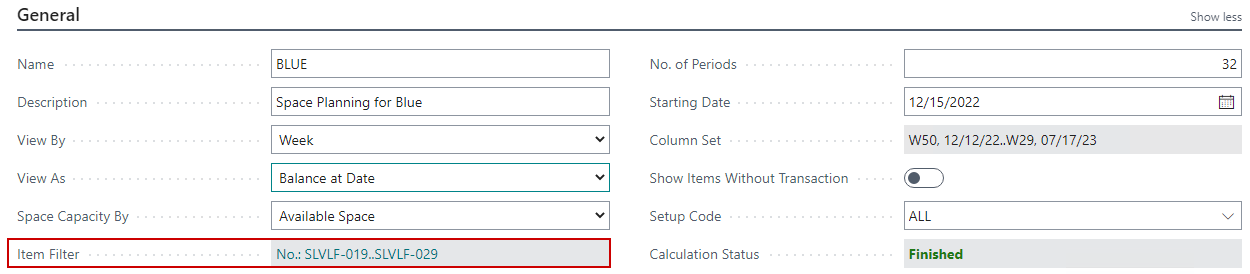
Click into the Item Filter if you want to view space based on a specific item or group of items.
Note
Adding filters will only show the space used for the items within the filter. So it can skew results if you want to view space as a whole of the location:
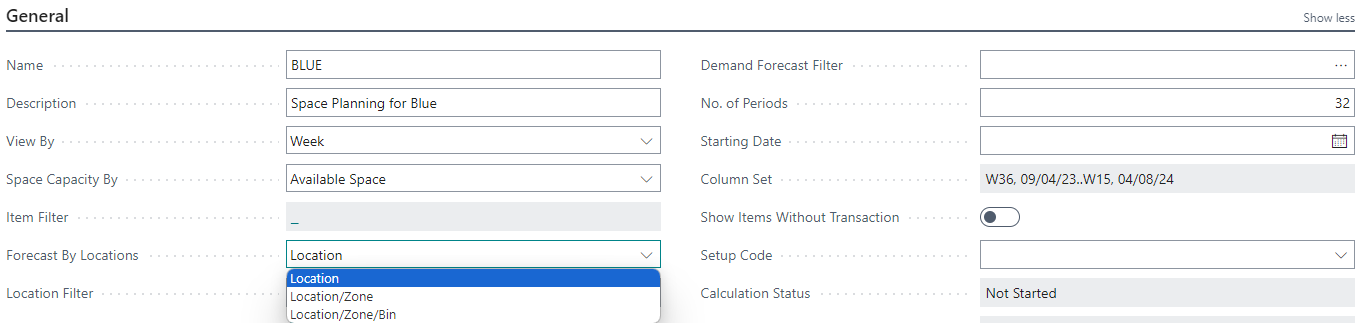
Select how granular to view the space calculations:
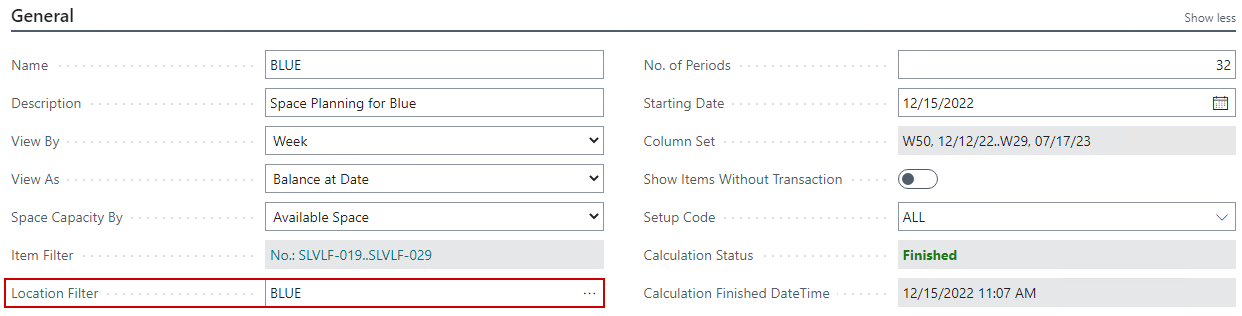
Enter in a Location Filter to view space for specific locations. If no location filter is entered, then all locations will be considered and have a line on the matrix:
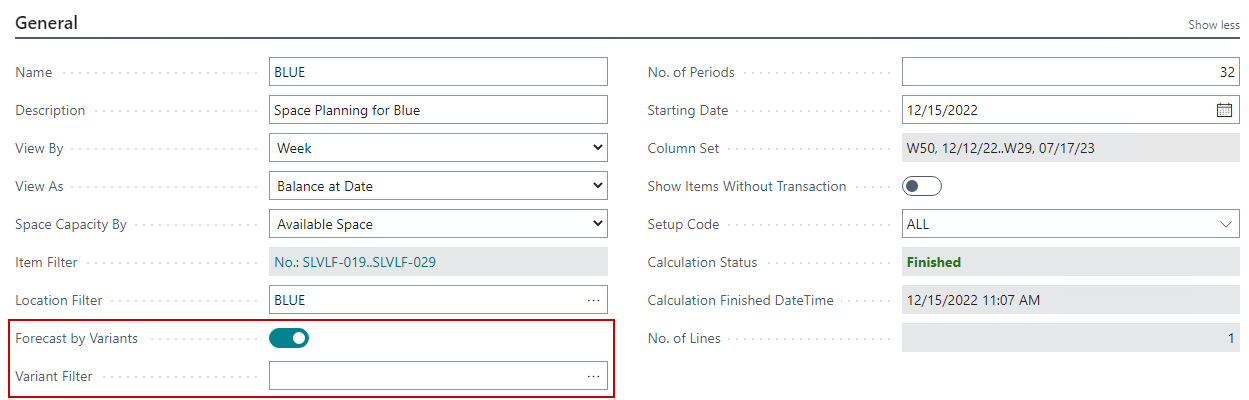
Toggle on the Forecast by Variants button to enter in a Variant Filter. If no Variant Filter is entered, then all variants will be included:
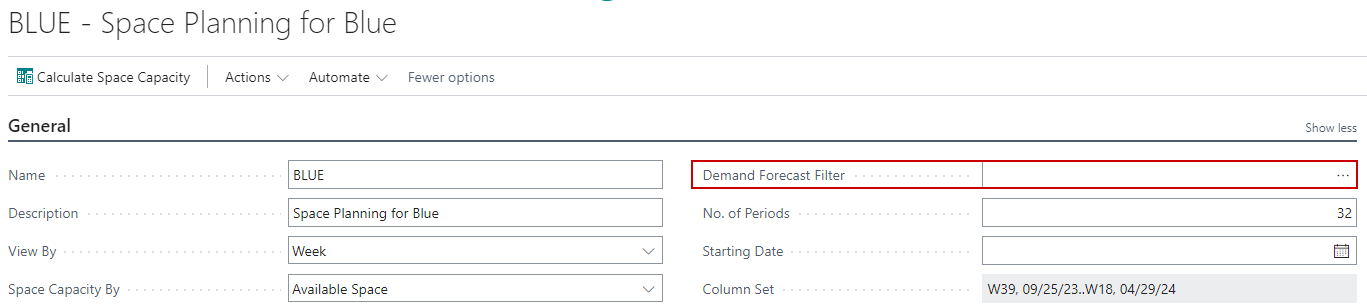
If you would like to view inventory projections, you can select a Demand Forecast:
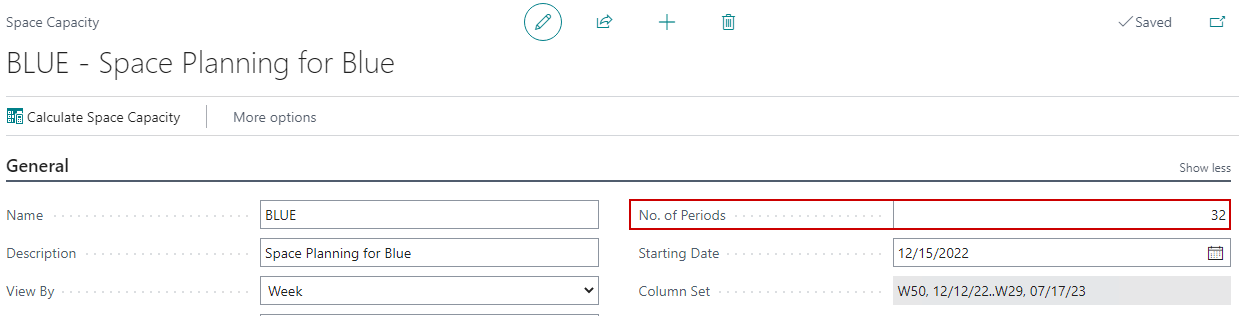
Enter in the number of periods you would like displayed on the matrix – up to 32 periods can be displayed:
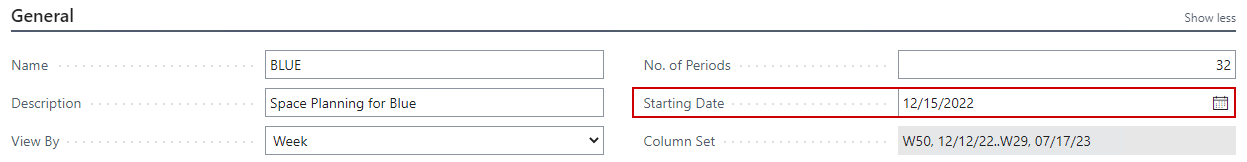
Enter in the date you would like the projections to start for. If left blank, it will assume today’s date:
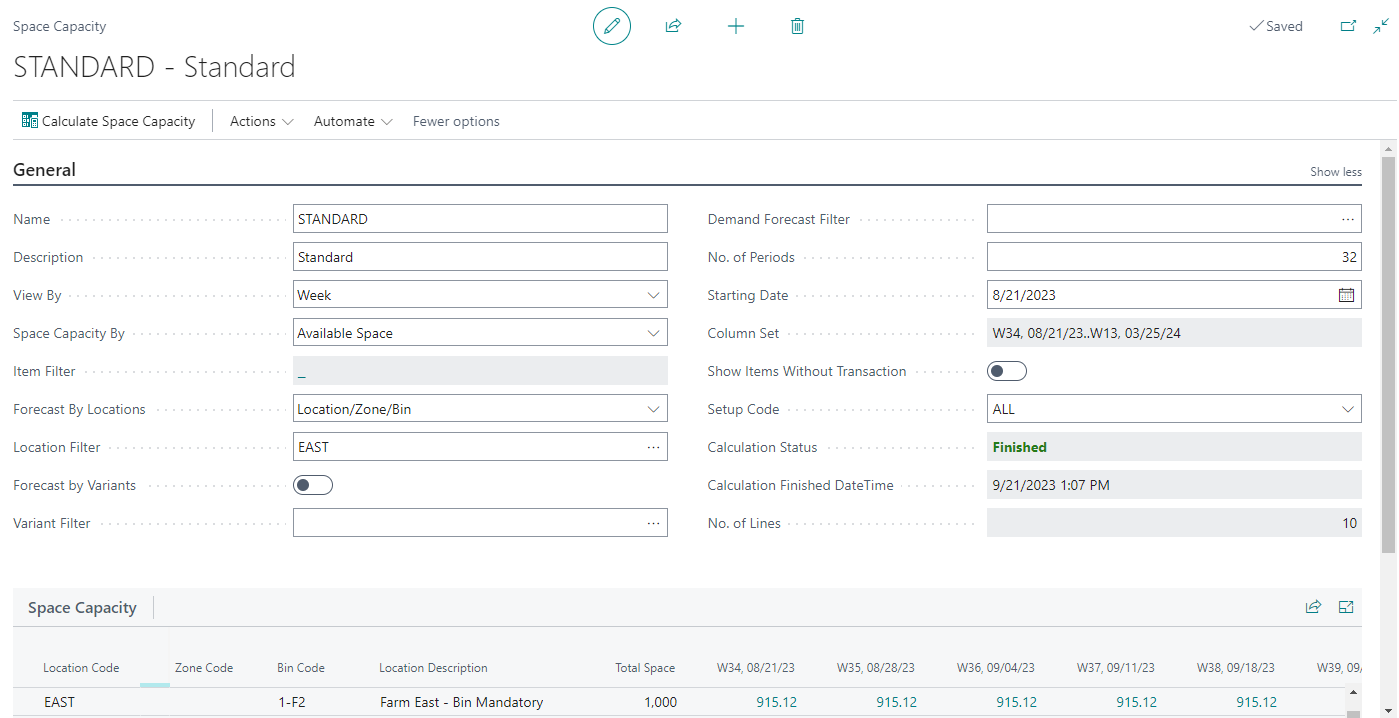
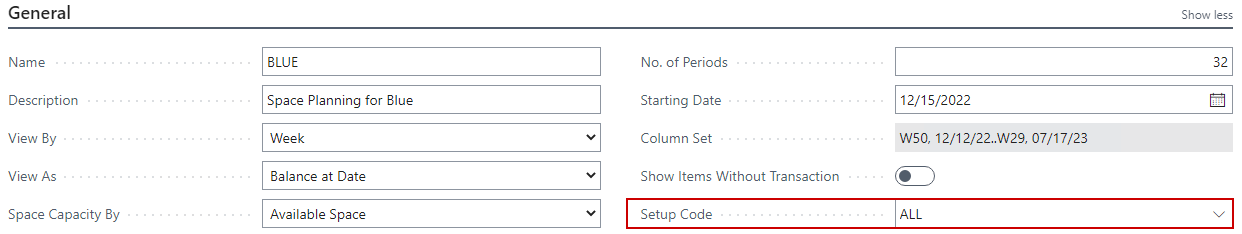
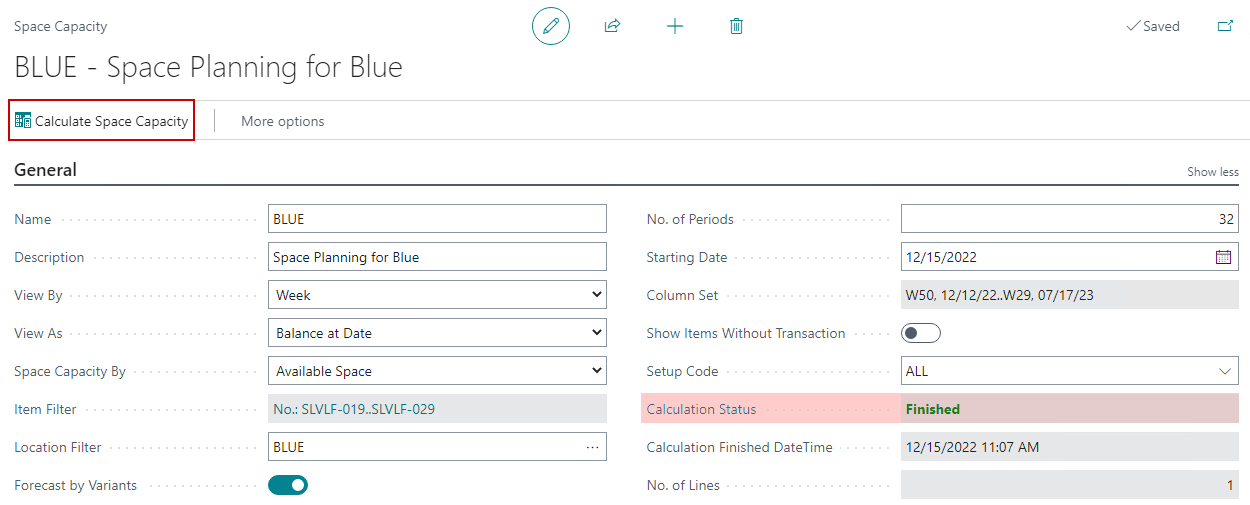
Select the Setup Code to designate what Supply and Demand sources you want considered in the capacity calculations:
On the menu, click Calculate Space Capacity. The Calculation Status will display Finished when it is completed:
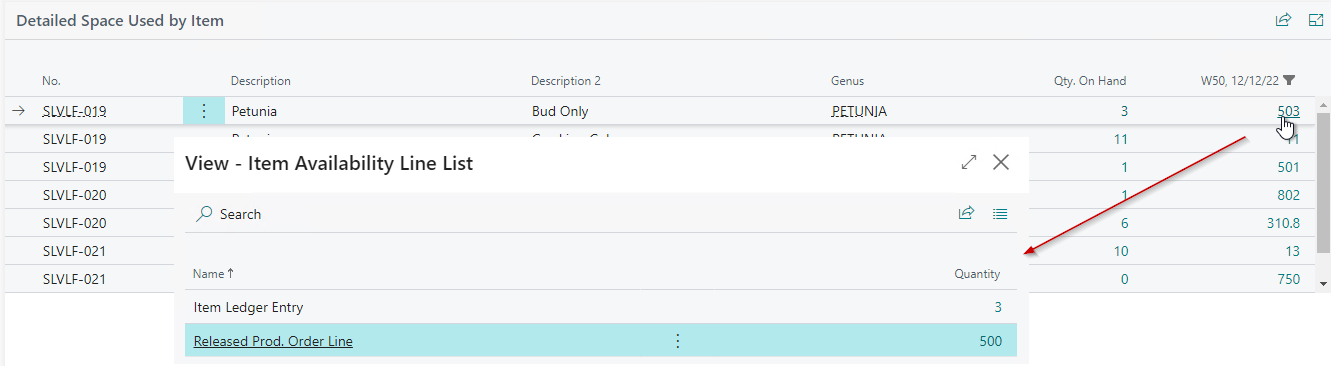
The results can be viewed in the Space Capacity Matrix lines. Clicking on the amount will show you the breakdown of the plants taking the inventory space:
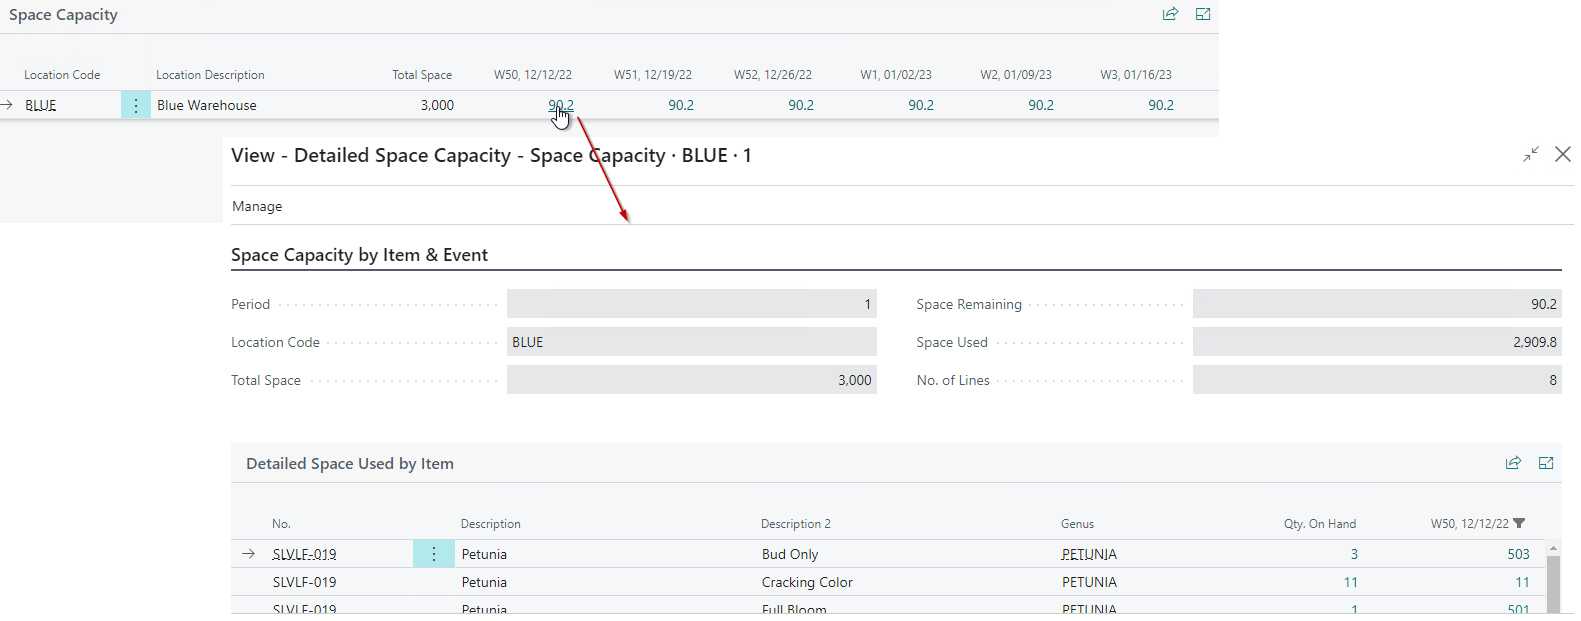
The supply and demand transactions that make up the space calculation can be viewed by drilling into the amount on the Detailed Space Used by Item page: